No items found in your cart!
No items found in your cart!
 you definitely can not afford to miss this. READ HERE https://www.hub.goglowonline.com/view-post.php?post_id=79, Thanks for always taking out time to read through our blog posts @ Goglow Hub! We are Happy that you enjoy it!&image=<img src='https://www.hub.goglowonline.com/upload/17684661671_vyIzwJMycg6NfUUb4G-HPA.webp'/>) |
|
|
|
|
|
|
|
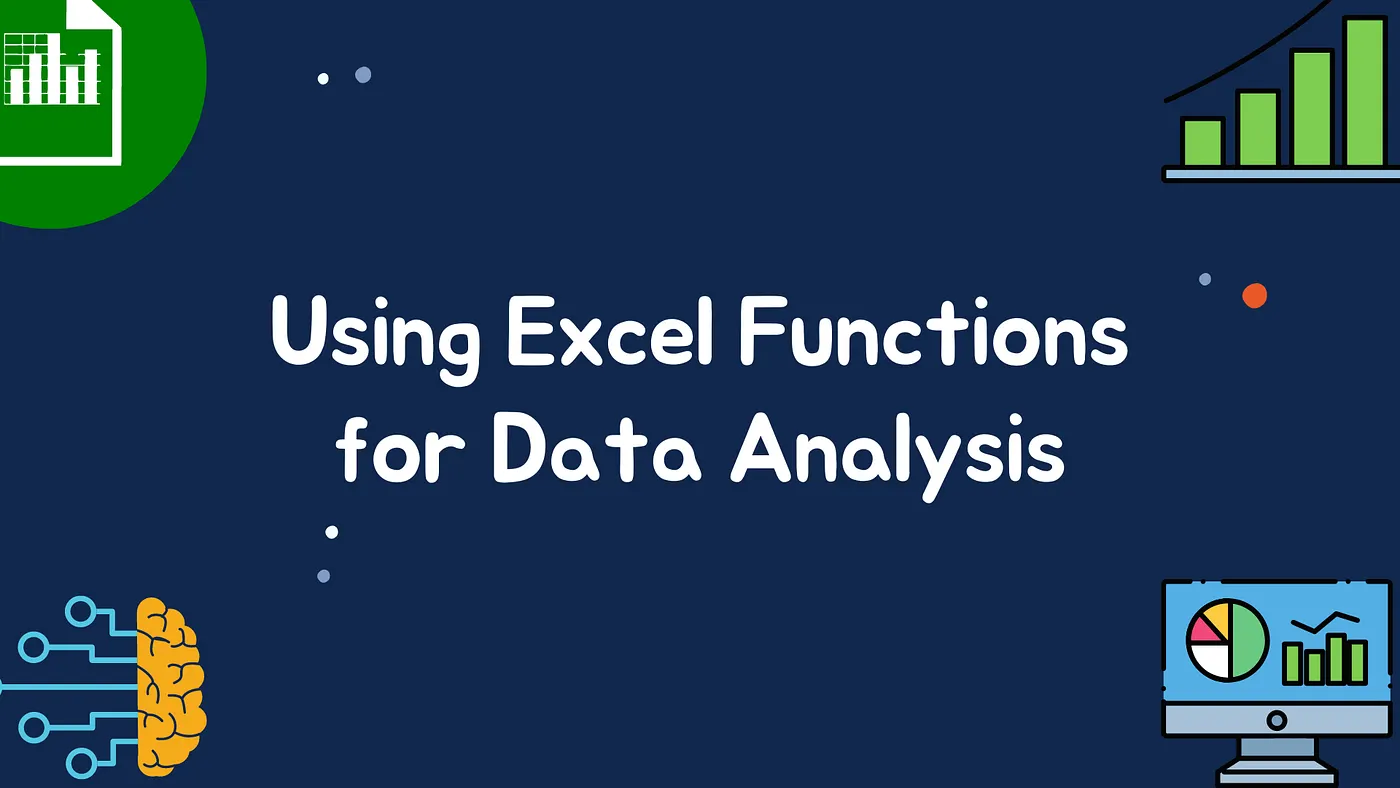
In today’s fast-paced business world, having the right financial insights can make all the difference between thriving and just surviving. For businesses, students, or budding analysts, Microsoft Excel remains one of the most powerful tools for financial analytics. With its vast range of functions and formulas, Excel allows you to analyze cash flows, forecast trends, track expenses, and make data-driven decisions.
At Goglow Hub, we believe that mastering these tools equips you for real-world financial challenges. Here’s a guide to the most useful Excel functions and formulas for financial analytics
1. SUM() – Totaling Your Data
The simplest but most crucial formula in financial analytics is SUM(). It helps you quickly calculate total revenue, expenses, or profits.
Example:
=SUM(B2:B20)
This formula adds up all the numbers in cells B2 through B20, giving you the total.
2. AVERAGE() – Understanding Trends
Knowing the average of a set of values helps identify trends, such as average monthly sales or expenditures.
Example:
=AVERAGE(C2:C13)
This returns the average value of cells C2 to C13, which could represent monthly revenue.
3. IF() – Making Conditional Decisions
Financial analysis often requires conditional logic. IF() lets you categorize data based on specific conditions.
Example:
=IF(D2>5000, "Above Budget", "Within Budget")
This formula checks if a value in D2 exceeds 5,000. If yes, it returns “Above Budget”; otherwise, it returns “Within Budget.”
4. PMT() – Loan & Investment Calculations
PMT() is perfect for calculating loan payments or investment repayments, considering interest rates and periods.
Example:
=PMT(0.05/12, 60, -20000)
Here, it calculates the monthly payment for a loan of 20,000 units at 5% annual interest over 60 months.
5. VLOOKUP() & XLOOKUP() – Searching Financial Data
When working with large datasets, finding the right data quickly is essential. VLOOKUP() and the more versatile XLOOKUP() are lifesavers.
Example:
=XLOOKUP("Client A", A2:A50, C2:C50)
This finds "Client A" in column A and returns the corresponding value from column C.
6. TEXT() – Formatting Numbers for Clarity
Financial reports need clarity. TEXT() allows you to format numbers as currency, percentages, or dates.
Example:
=TEXT(E2, "₦#,##0.00")
This converts a number in E2 into Nigerian Naira currency format.
7. FORECAST() – Predicting Future Trends
Forecasting is vital in budgeting and financial planning. Excel’s FORECAST() formula predicts future values based on historical data.
Example:
=FORECAST(F13, B2:B12, A2:A12)
It predicts the value for F13 based on known values in B2:B12 and corresponding dates in A2:A12.
8. PivotTables – Summarizing Financial Data
While not a formula, PivotTables are indispensable for financial analytics. They allow you to summarize expenses, sales, or cash flows in seconds without manually calculating totals or averages.
Pro Tips for Financial Analytics in Excel
1. Use named ranges for easier formula management.
2. Combine IF() with SUM() or AVERAGE() for conditional totals.
3. Leverage conditional formatting to highlight trends, risks, or unusual expenses.
4. Regularly audit formulas to ensure accuracy in reports.
At Goglow Hub, we train students and professionals to not just use Excel, but to leverage it for practical financial decision-making. By mastering these functions and formulas, you can analyze your business performance, forecast trends, and make smarter financial decisions with confidence.


![]() Courses
Courses
 Graphics Design
 Web Development
 Mobile App Development
 System Application Development
 Computer Appreciation
 Architectural Design
 UI/UX Design
 Programming
 Software Development
 Computer Repairs
 Solar Panel Installation
 CCTV Installation
 Digital Photograpghy
 Digital Marketing
 Data Analytics
 Database Management
 Ethical Hacking
 Blockchain Development
 Jamb CBT Practice
 TOEFL Training
 IELTS Training